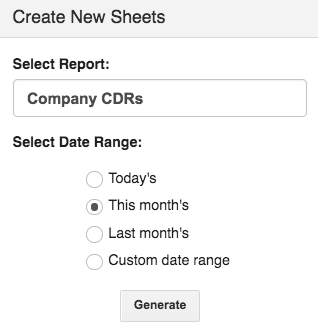
net2phone Canada's Google Sheets™ add-on is a tool that allows you to download your call data into a spreadsheet quickly. Learn more about the different sheets you can create in the net2phone Canada Google Sheets™ Add-On - The Basics article.

Having all this data at your fingertips within minutes is excellent, approaching a giant data dump can be overwhelming and time-consuming to stifle through.
There are so many figures you can derive from the "Company CDR's" call data spreadsheet. Every business has different goals and uses for the information you can extrapolate from this report. To give you an idea of how to refine your Company's CDRs data-dump this article will show you how we, at net2phone Canada, use our add-on.
PIVOT TABLES
Pivot tables are one of the best tools to use when analyzing spreadsheet data.
- Allow you to summarize data quickly.
- Provide easy refreshes for break-down summaries.
- Require less clicking and user input than formulas.
- Generally provides more accurate information than solely using filters.
EXAMPLE USE CASE
Call Data Records are typically distilled into two main pivot tables, used to track the daily productivity of our client care teams.
1. Outbound calls + count + talk time
2. Inbound calls + count + talk time
When creating pivot tables, it's helpful to think of your pivot table through rows OR columns, but not both.
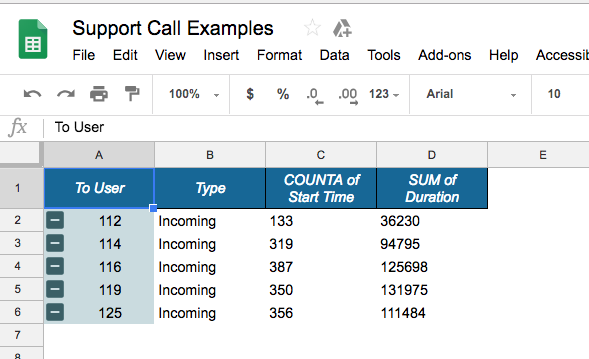
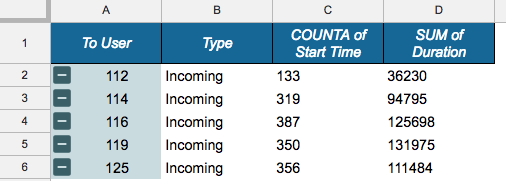
In this example, we are reading the tables through rows; even though it is the columns that are titled—the table's data is dependent on the users' extensions. Although the title categories are displayed as columns, i.e., "To User," you must read the data horizontally through the rows, viewing the user with the extension number 116 with a SUM Duration of 125698 minutes.
WHAT WE WANT TO KNOW
While the numbers don't necessarily tell the whole story, they can be monitored for trends and create concrete stepping stones for meaningful questions.
Some examples,
- An agent taking most of the inbound calls, but has the least amount of talk time; this agent could be resolving cases faster, or they could be elevating more calls and handing off cases more readily than other agents.
- An agent having significantly lower talk times and call counts; this could be an opportunity to review the agent's behaviour or determine if additional training is required.
HOW WE GOT THERE
You must create separate inbound and outbound pivot tables when looking at user extensions.
OUTBOUND PIVOT TABLE
Our pivot table will include outbound calls + count of start time + duration of the call.
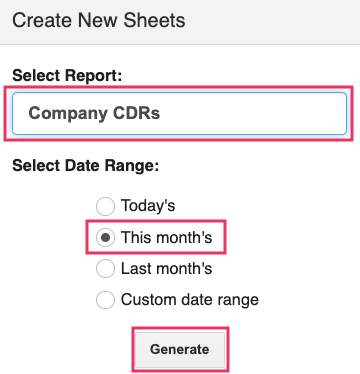
Follow these instructions after you have generated a Company CDR sheet with a predetermined time period.
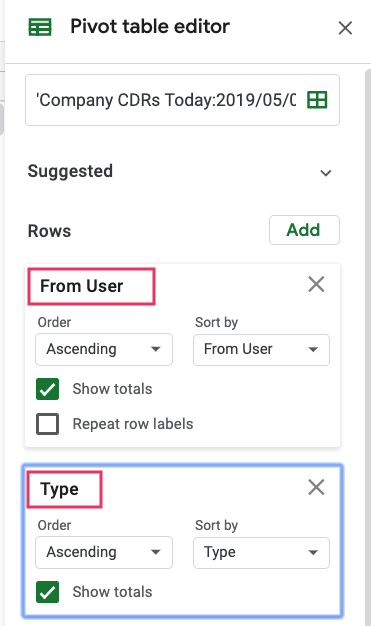
1. ADD ROWS AND VALUES
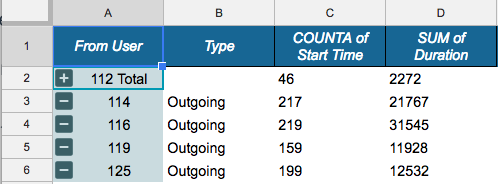
Rows = From User + Type Values = Start Time + Duration
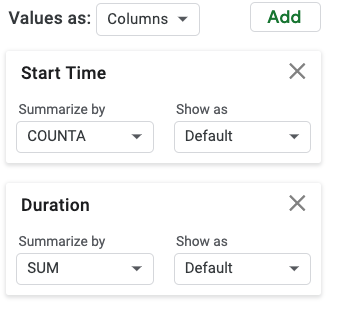

After the data is defined you will see a nonformatted table that looks like the image below.
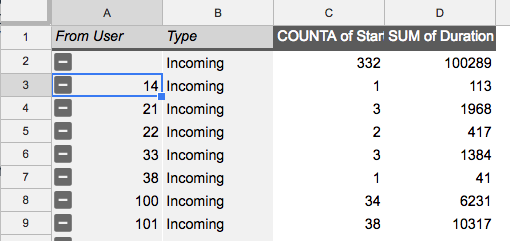
In the "To User" and "Type" columns, there are still data included from all users in the company. To refine your pivot table, you must use filters found in the pivot table editor.
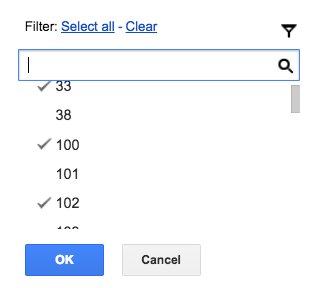
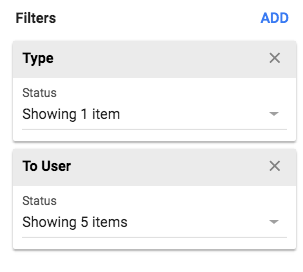
2. ADD "FROM USER" AND "TYPE" FILTERS
Scroll down to the bottom of the pivot table editor and add a "From User" filter. Once added you can select the users you want to include in the table.
For this table we only want to see outbound calls, so we also add a "Type" filter.
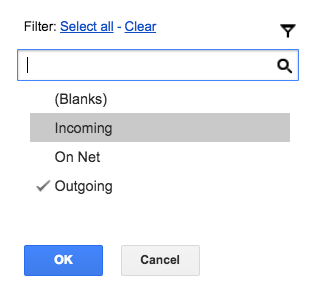
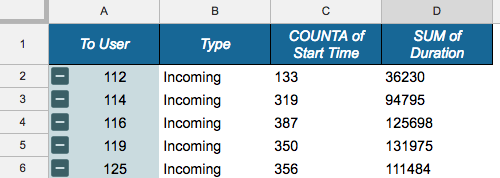
Once that is done our table our reformatted table will look like:
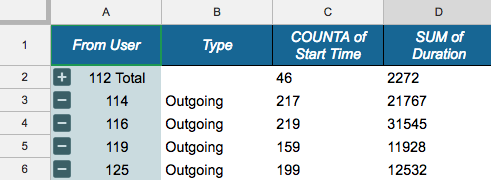
Now our outbound call table is done, we'll repeat the same steps to create the inbound pivot table.
INBOUND PIVOT TABLE
Use the same process for the Inbound Pivot Table as you did for the Outbound Pivot Table, only with "To User" for the row and filter so the table shows incoming calls to specified extensions.
Now both our pivot tables have been created; we can take it to the next level. Learn how to create an Impact Table with some basic formulas.
