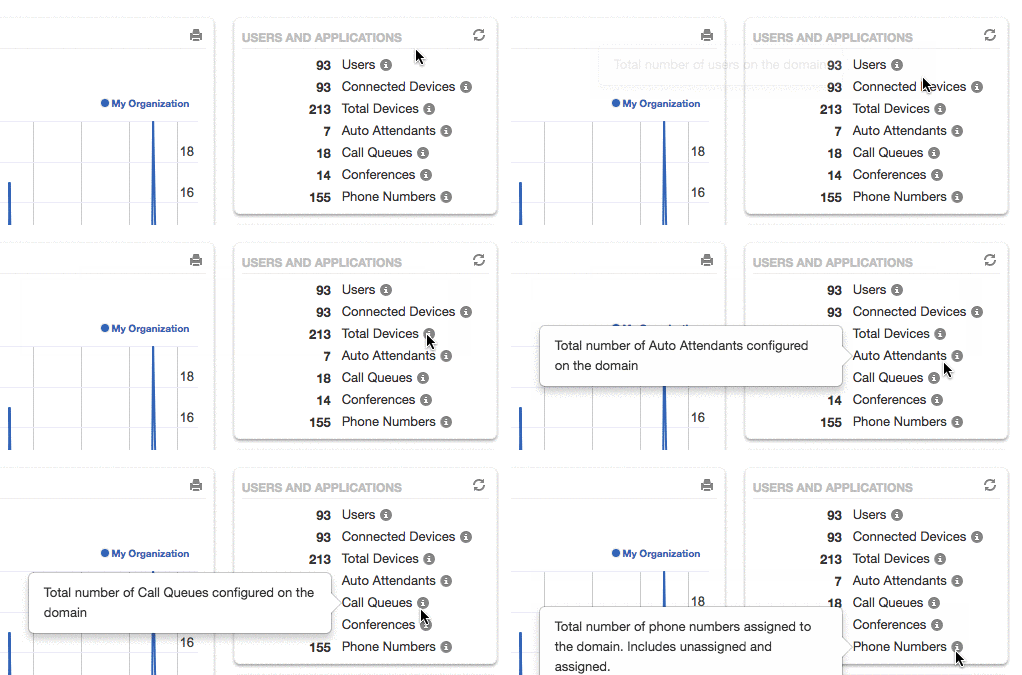

This article overviews the features available to you from the Home tab in your SONAR portal when you are in “Manage Organization” view. The Home section is designed to give you fast access to the most important and frequently viewed information.
There are four components of the Home section:
- Call Graph
- Current Active Calls
- Users and Applications
- Usage Stats
CALL GRAPH
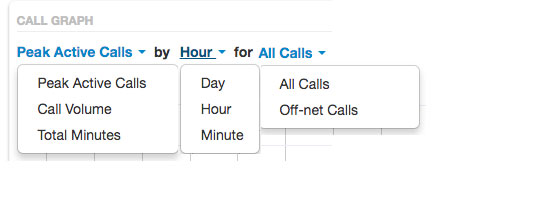
The call graph is designed to provide a fast way to view your companies data. You can easily adjust what information, and what time period you want to view. Graphs can be generated by peak active calls, call volume, or total minutes. Additionally, graphs can be filtered by day, hour, and minute—for all calls or off-net calls.
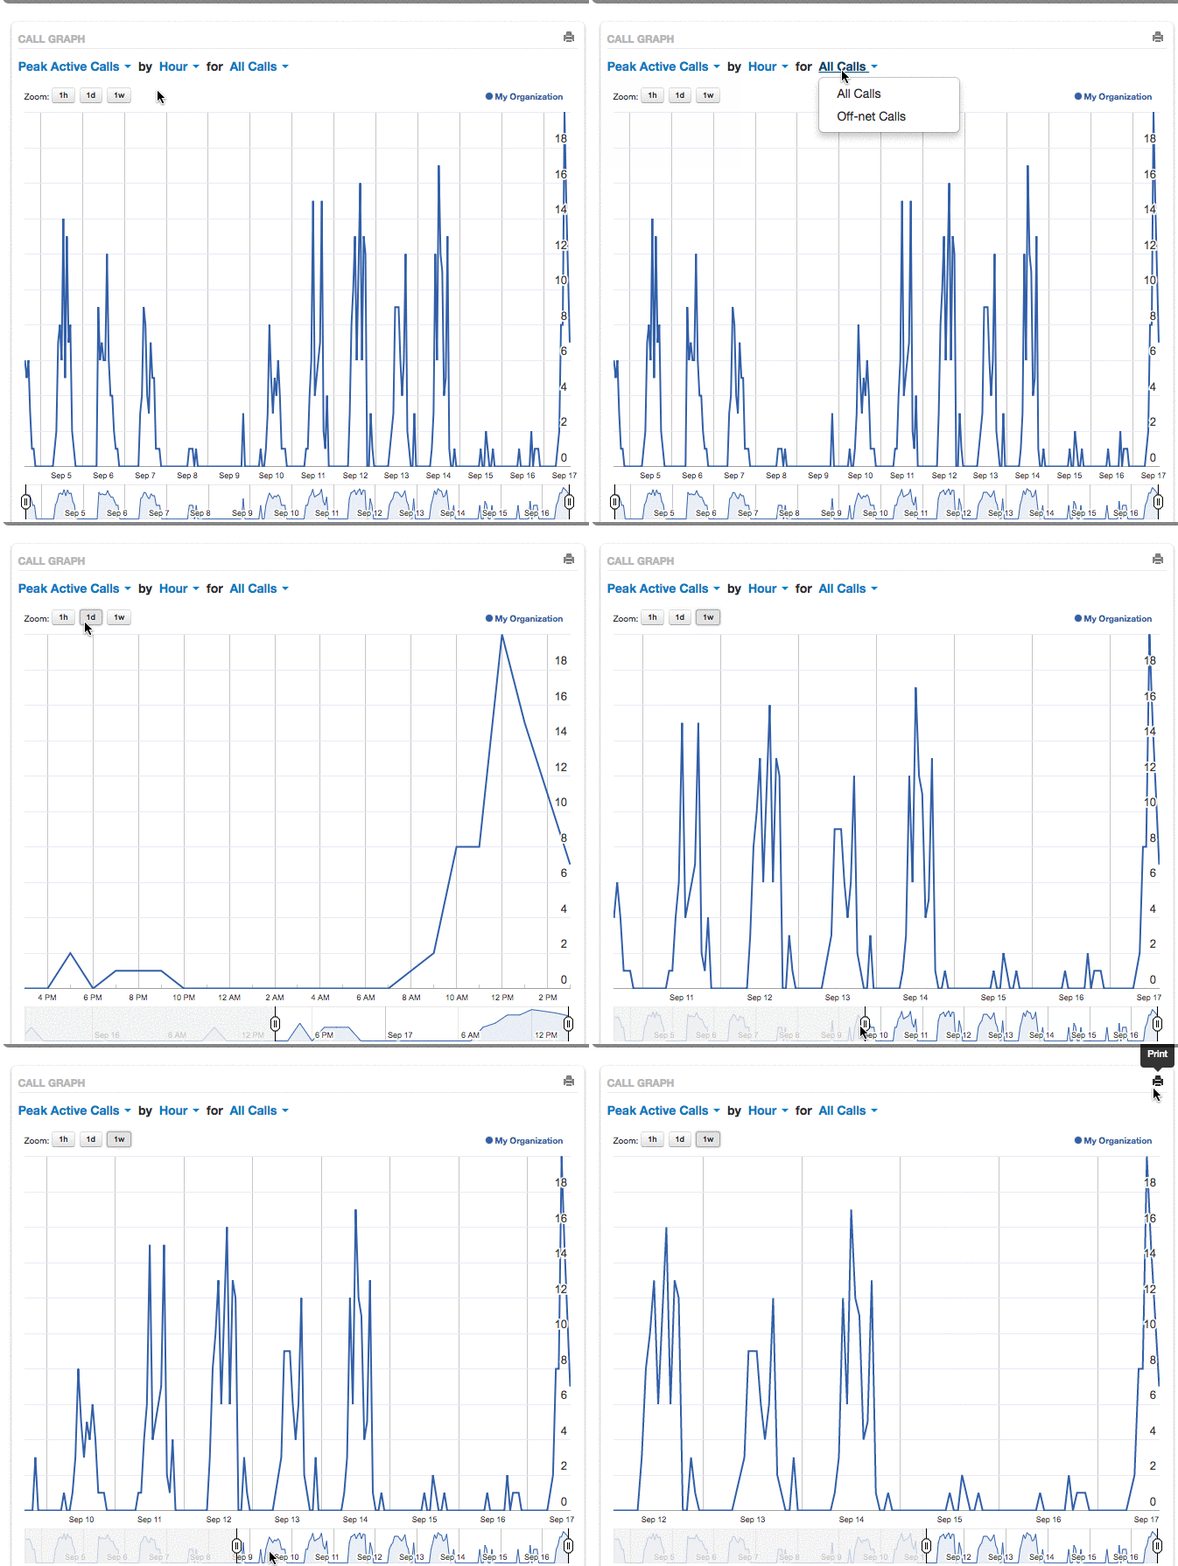
You can also quick zoom on the current hour, day, or week.

Under the main graph is a smaller graph that allows you to slide the start and end dates/times to quickly fine-tune what data you want the main graph to display.
By day:
By week:
By hour: 
CURRENT ACTIVE CALLS
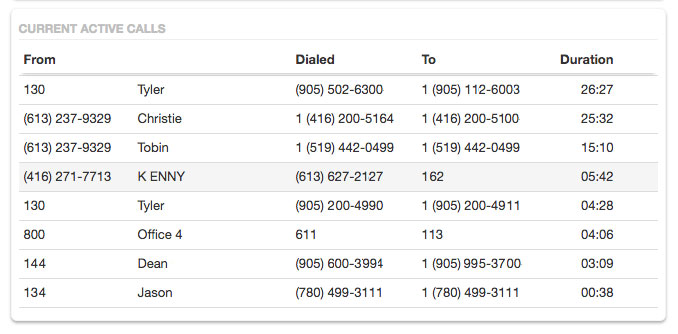
The current active calls section lists all the currently active calls within the company by the from the extension or caller ID, name of the caller, the dialed number, the recipient, and the duration of the call.
Sometimes refreshing the page is necessary for SONAR to register that a call has ended.

USERS AND APPLICATIONS + USAGE STATS
On the right side of the page, there are some figures and statistics pertinent to your company and its operations. The Users and Applications section lists a head-count for users and devices while the Usage Statistics lists current stats, this months stats, and last month's stats.
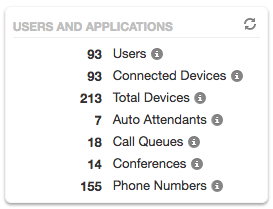
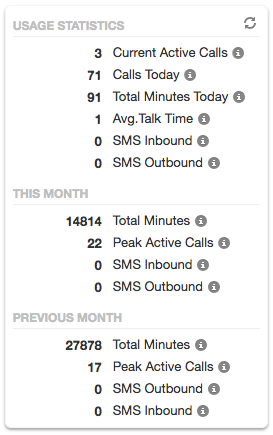
If there is ever a figure or a stat you want to know more about, all you have to do is hover over the information circle next to the name for a short description.
