This article follows up the Versature's Google Sheet™ Add-On Beyond the Basics after both the inbound and outbound pivot tables are built. Creating an impact table will elevate the data in such a way information can be understood with new clarity.
For the sake of ease, we recommend making this new table in the same spreadsheet as either the inbound or outbound calls. For this example, the table is being created in the outbound sheet.
STEP ONE: CREATE YOUR TITLES
Your titles will include any information necessary to draw the conclusions you have set out to determine. This will help you keep track of what information you've already included and where you're going with your table.
Ours include the following titles:

STEP TWO: INPUT YOUR DATA ONE COLUMN AT A TIME
|
NOTE: You don't have to input your data from left to right, but it can make your table easier to read and creates a better flow of data input. |
|
TIPS:
|
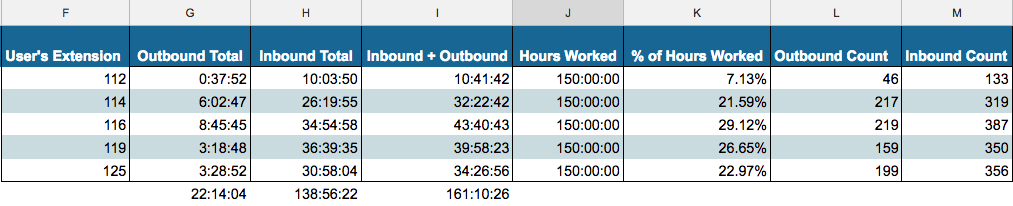
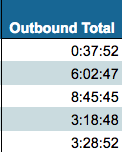
OUTBOUND TOTAL
The outbound total shows the amount of a time (duration) that a user has spent on dialed-out phone calls within your pre-set period of time.
Cell formula:
=D#/86400
To change seconds to minutes and hours, follow the formatting:
Format > Number > Duration
If you don't know how to do this, see How to Change Seconds to Minutes and Hours in Google Sheets™
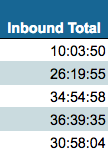
INBOUND TOTAL
The inbound total shows the amount of a time (duration) that a user has spent on answered phone calls within your pre-set period of time.
|
NOTE: Because we have created our impact table on the same sheet as the outbound pivot table, the formula took information from several cells over when we did this for outbound calls. The inbound pivot table was created in a different sheet, which means there is a little more work involved to migrate that information over. |
Before you can add this data to your new table you need to follow the same formula as the outbound total but in the inbound pivot sheet.
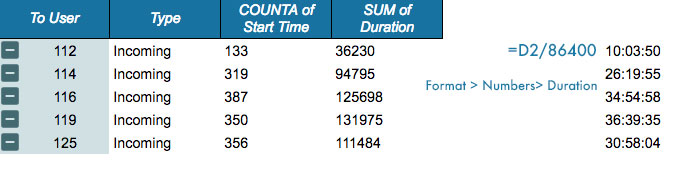 The cell formula depends on the title of your inbound pivot table.
- Navigate to your outbound pivot table and the new BLANK table.
- Click the first cell of the "Inbound Total" column
- Press the equals sign in the first cell of the row.
- Navigate back to the inbound pivot table.
- Click the first cell of the column you just created.
- Click enter to lock in that value.
- Click and drag down the rest of the column to auto-fill the remaining rows.
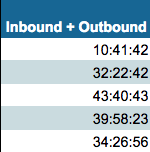
OUTBOUND + INBOUND
Cell formula:
=F#+H#
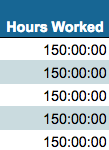
HOURS WORKED
The number of hours worked will depend on the time period you generated the sheet and how many hours in a day people work. For this example, the pivot tables were generated from a month-long time period at 7.5 hours a day.
7.5 X 5 = 37.5
37.5 X 4 = 150
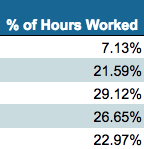
% OF HOURS WORKED
Formula
=I#/J# (i.e., inbound + outbound)
Format > Numbers > Percent
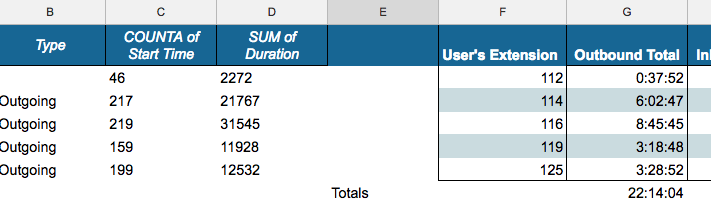
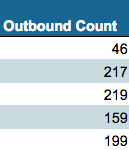
OUTBOUND COUNT
The outbound count is the same value as the "Start Time" in the original pivot table.
Formula
=C#
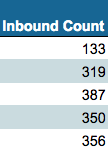
INBOUND COUNT
Like the outbound count, the inbound count is the same value as the "Start Time," but from the inbound pivot table. To add this data to your impact table, you can follow the same steps as the "Inbound Total."
Refining your data can really help to understand a call center/call queues performance as a whole and your agents individually.
- If you would like to move the new table to a new spreadsheet afterward all you need to do is copy/paste.
- "On-net" calls are those made between two Versature clients or internal calls.
- Tracking these metrics and monitoring them can provide concrete reasons why an employee should or shouldn't get promotions or bonuses.
